Nervecentre V9.0 Help for Users
Viewing utilisation charts about your clinic's appointment slots
Clinic utilisation charts
You can view utilisation charts about your clinic's appointment slots and how they were used. For example, all the appointment slots that were available and booked during a specific time period. This can help you evaluate clinic capacity and demand, which can help you plan your future appointment slots.
Viewing utilisation charts about your clinic's appointment slots on a mobile
You can't do this on a mobile.
Viewing utilisation charts about your clinic's appointment slots on a desktop
 Viewing a utilisation chart about your clinic's appointment slots
-
From Outpatients > Manage > Utilisation, select your search criteria.
Use the table below to choose your search criteria. You must choose a specialty and date range.
Specialty
Select a specialty to search for appointment slots at any clinic for this specialty.
For example, all the appointment slots at any dermatology clinic.
Clinic
Select a clinic to search for appointment slots at that clinic.
For example, all the appointment slots at a specific dermatology clinic.
You must select a specialty before you can select a clinic.
Resource
Select a clinic resource to search for appointment slots for that resource.
For example, all the appointment slots with a specific dermatology consultant.
You must select a clinic before you can select a clinic resource.
From
Select a date to search for appointment slots from this date.
To
Select a date to search for appointment slots until this date.
Status
Select a status to only view appointment slots with this status.
For example, all appointment slots that are available.
Chart
Select the type of chart you want to view.
For example, the number of appointments with a specific status for each month.
-
Select .
A table and a chart appear.
Overview of Manage > Utilisation
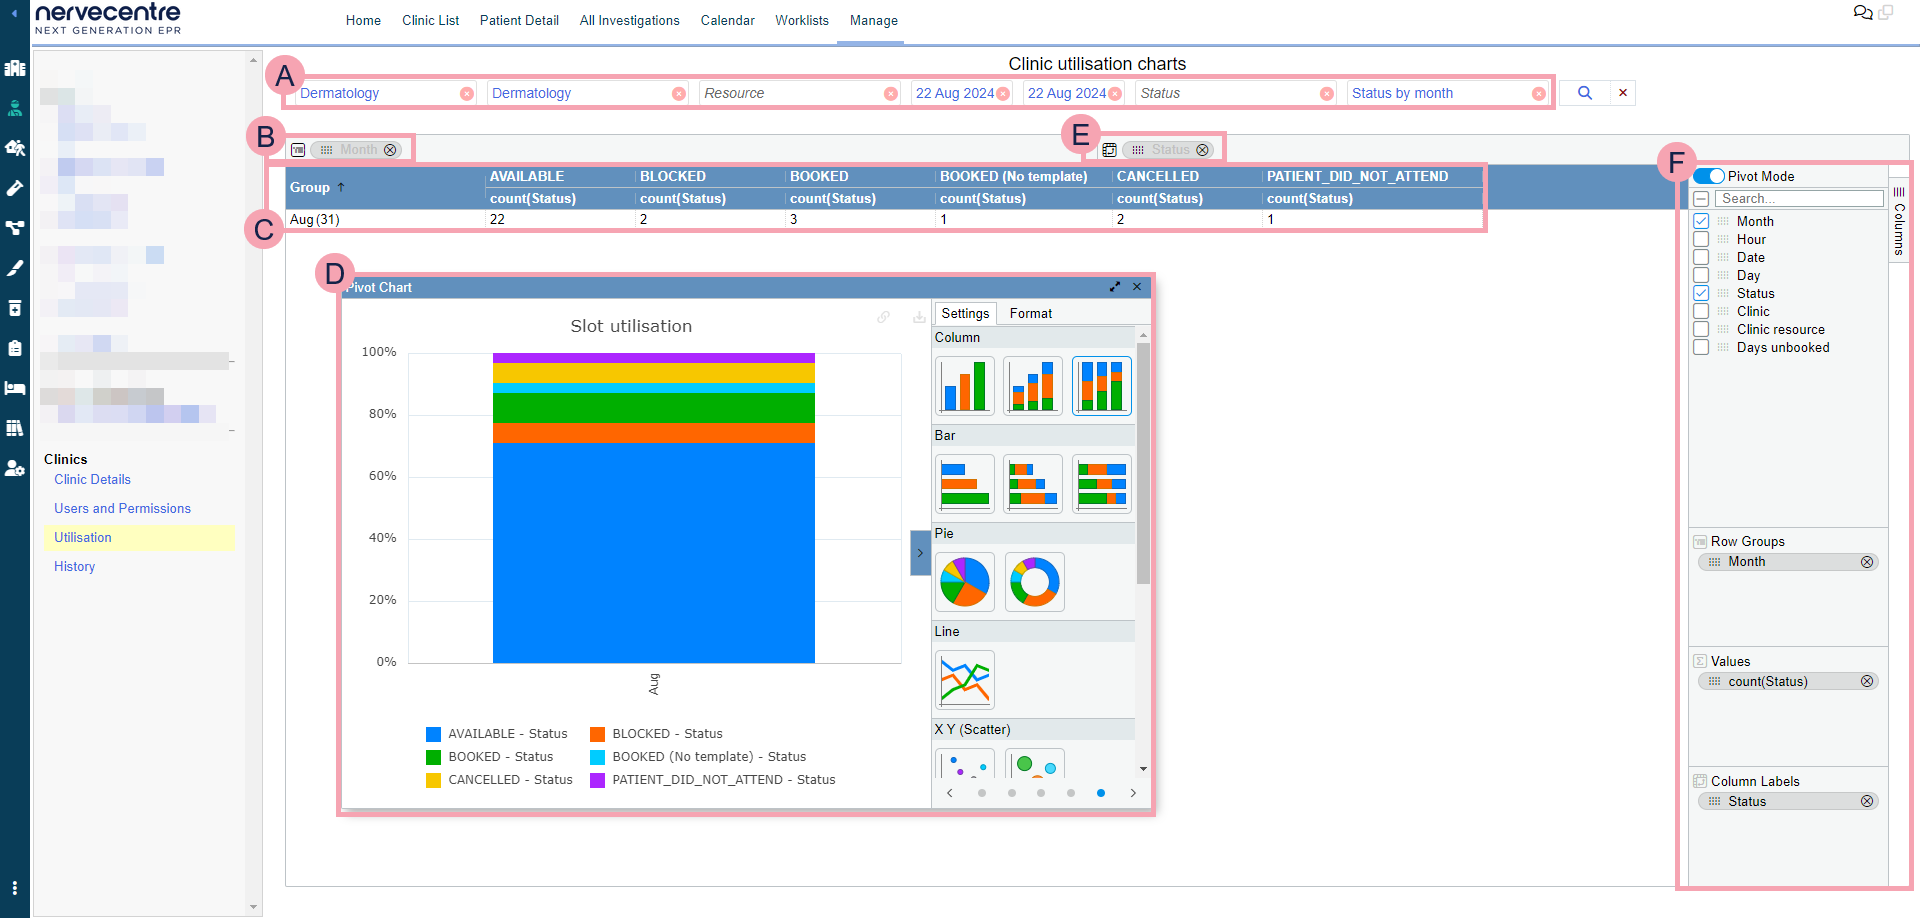
From Outpatients > Manage > Utilisation, you can view utilisation charts about your clinic's appointment slots.
|
|
Here you can select the criteria for your search. To clear one search term, select next to the search term. To clear your whole search, select next to . |
|
|
Select to search. |
|
|
Drag items here to group rows by that item. The items can be column headings from the table, or items from the list on the right. Select next to the name of a group to remove it. |
|
|
Shows the table of data returned by your search. Select a column heading to sort the data by that heading. |
|
|
Shows the pivot chart. Select and drag a corner of the chart to change the size of the window. Select to make the window take up the width of the full screen. Select to close the pivot chart window. |
|
|
Drag items here to set column labels. The items can be column headings from the table, or items from the list on the right. Select next to the name of the column label to remove it. |
|
|
Select to turn on pivot mode and view the pivot chart. Select items in the list to group rows by that item. Clear items in the list to remove groups. You can drag items in the list to other areas. |


 Overview of the pivot chart
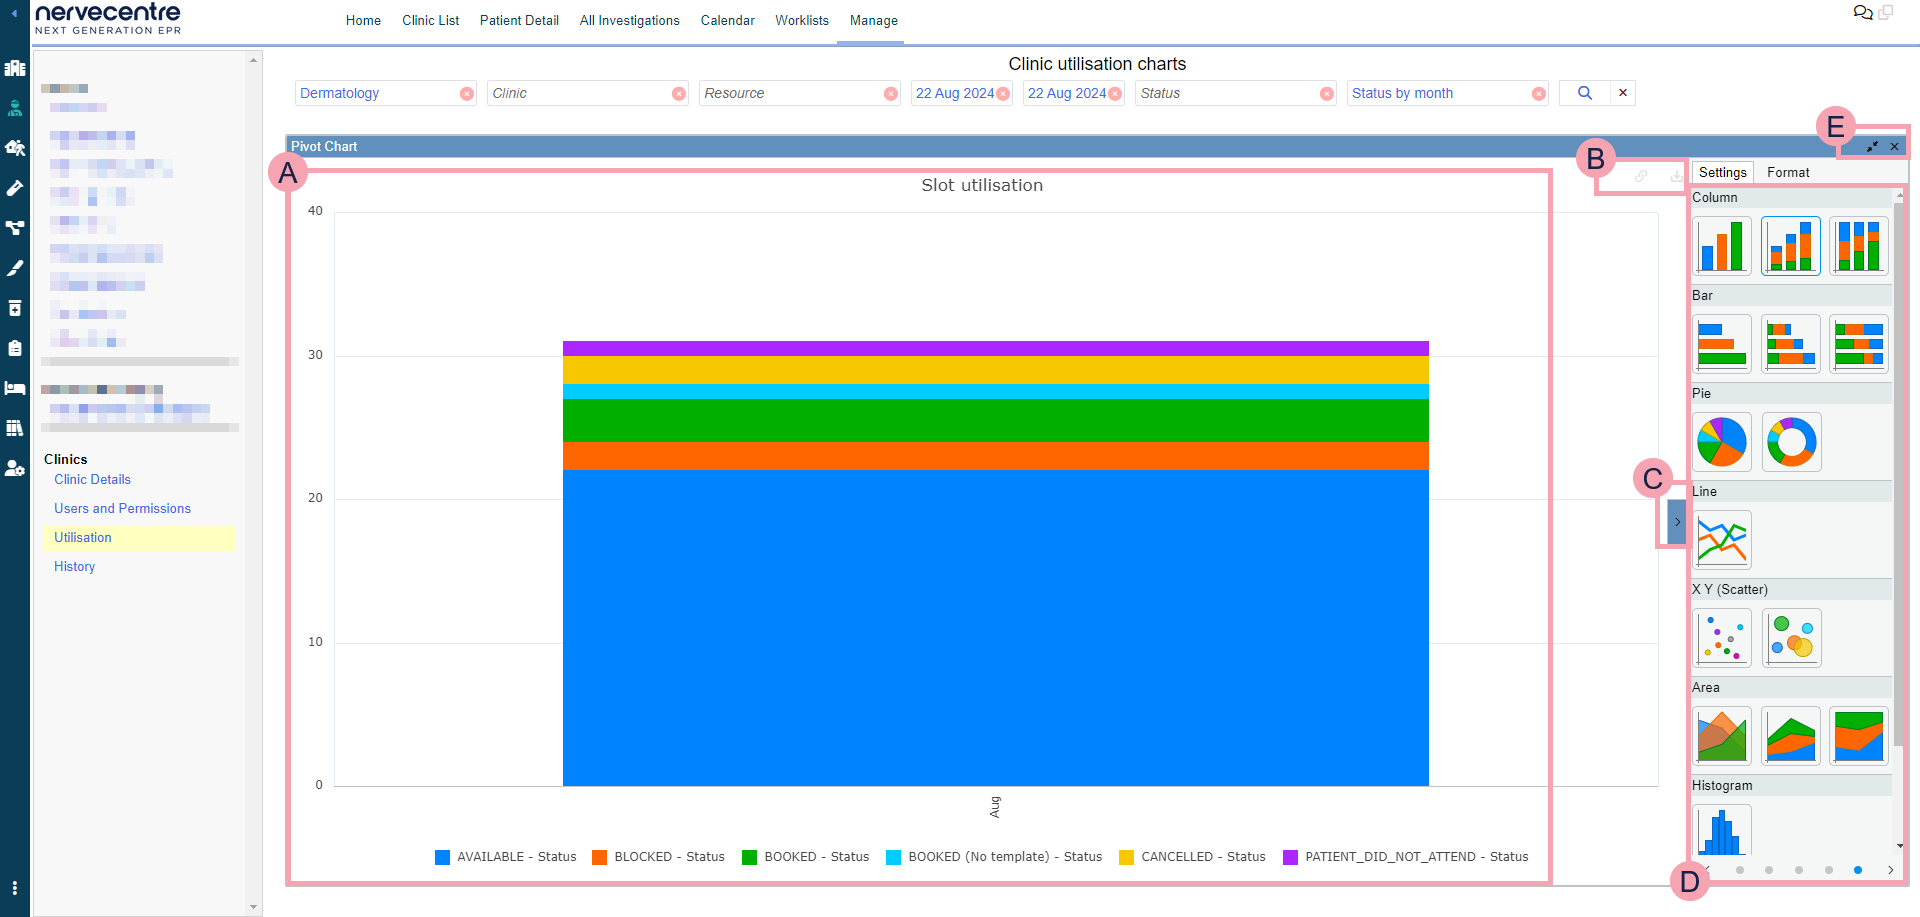
Settings
|
|
Shows the chart. Mouseover parts of the chart to view more information. |
|
|
Select to link and unlink the chart from the table of data. Select to export the chart as a .png image file. |
|
|
Select to show and hide settings for the chart. |
|
|
From Settings, select the type of chart for your data. You can scroll to view more charts. |
|
|
Select to reduce the size of the chart window. Select to close the chart window. |
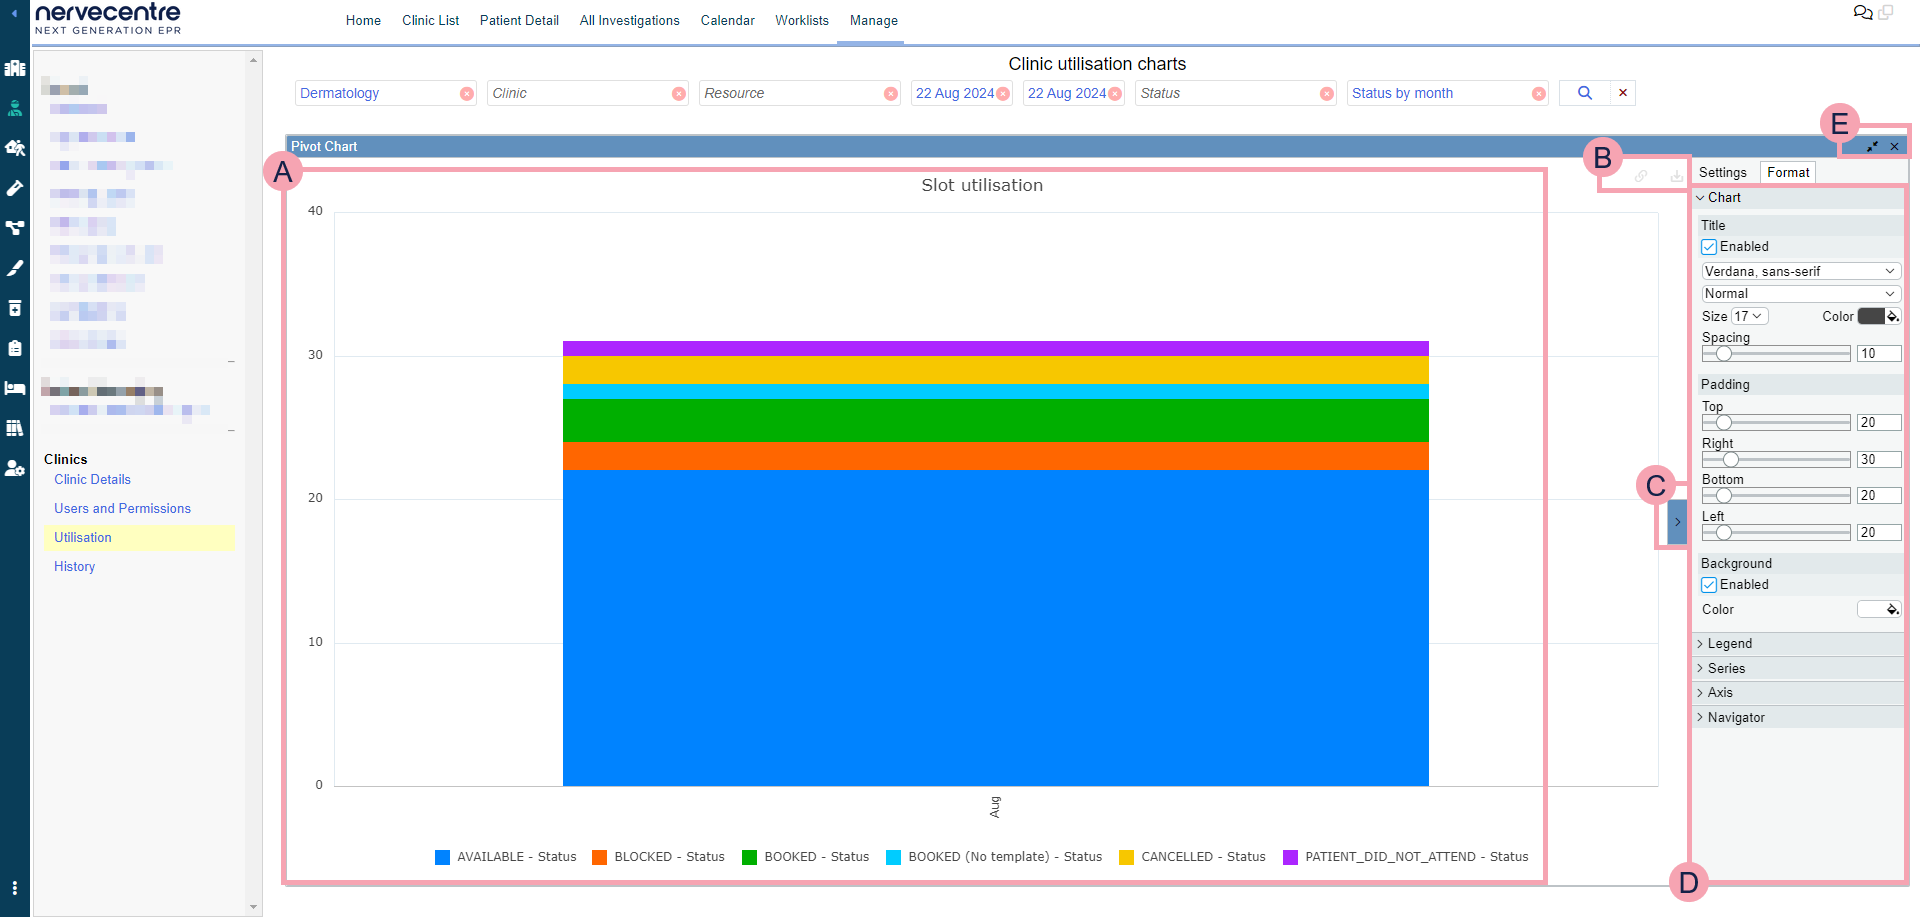
Format
|
|
Shows the chart. Mouseover parts of the chart to view more information. |
|
|
Select to link and unlink the chart from the table of data. Select to export the chart as a .png image file. |
|
|
Select to show and hide settings for the chart. |
|
|
From Format, you can:
|
|
|
Select to reduce the size of the chart window. Select to close the chart window. |
Did you find this article helpful? Yes No
Sorry about that. Our help is a work in progress and we welcome any feedback.
Why wasn't this helpful? Please select one reason:
Great!
Thanks for taking the time to give us some feedback.